
Finding a balance between urbanisation and nature is one of the main challenges nowadays. Fresh air, clean water and availability of green space are becoming increasingly important factors when choosing a place to live.
Vegetation and especially trees in green areas of cities play an important role in the mitigation of negative impacts and social consequences of urbanisation and make cities more resilient in these aspects. Therefore, the greenness of cities is an important factor that could be assessed and trends analysed using Earth observation data in combination with available geospatial data. This article presents the case study of greenness evaluation in Cēsis, Latvia.
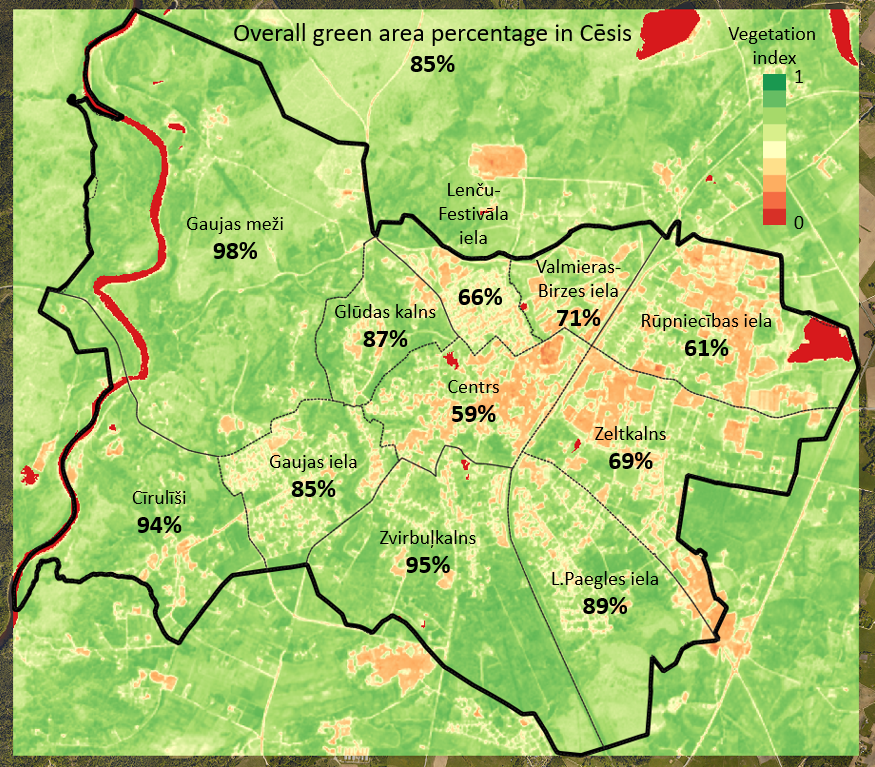
Vegetation density in a certain area can be measured using spectral satellite data and expressed as a vegetation index. It is calculated from spectral bands in the red and near-infrared spectral range and represents vegetation intensity in a certain area – combination of vegetation cover density and chlorophyll concentration. Vegetation index could be used not only for quantitative assessment and mapping of greenness but also for evaluation of trends, because satellite data are acquired on a regular basis. A greenness status map of 2020 for the city of Cēsis is shown in Figure 1, with vegetation-dominant areas in green and built-up areas reddish. The overall green area percentage in Cēsis is 85%. Gaujas meži and Cīrulīši are the greenest districts, with green area percentages of 98% and 94%, respectively. The greenness of central and north-eastern districts are below the overall 85% threshold. The least green districts are an industrial area (Rūpniecības iela with 61%) and the city centre (Centrs with 59%). These districts may be more susceptible to the negative impacts of urbanisation (e.g. heat islands). Such an approach enables a comparison of the greenness of different districts and cities as well as an analysis of temporal changes. In the case of Cesis, the green area percentage has remained around 83–85% between 2016 and 2020.
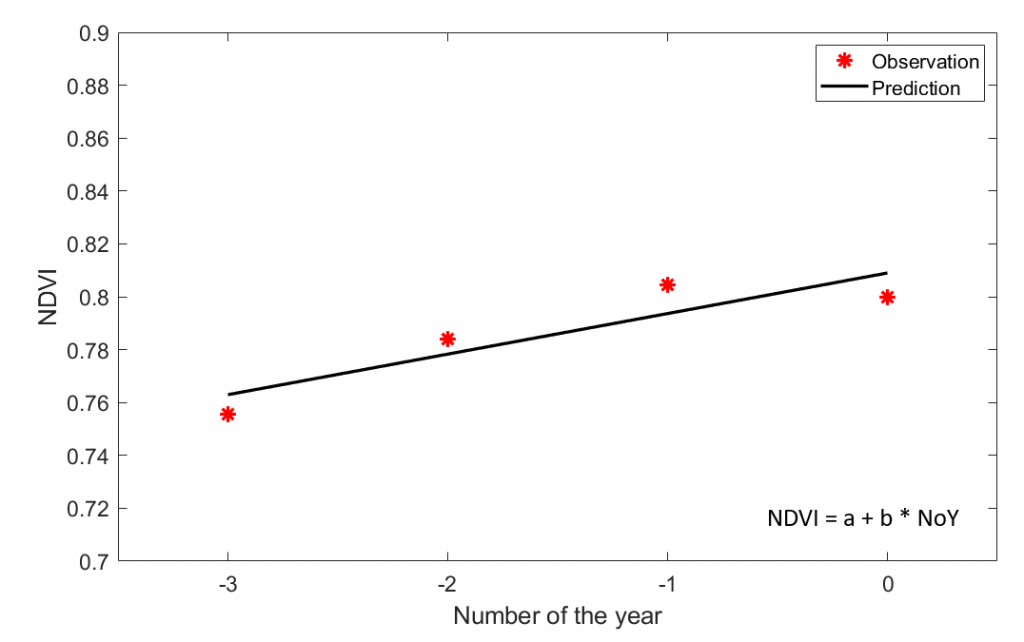
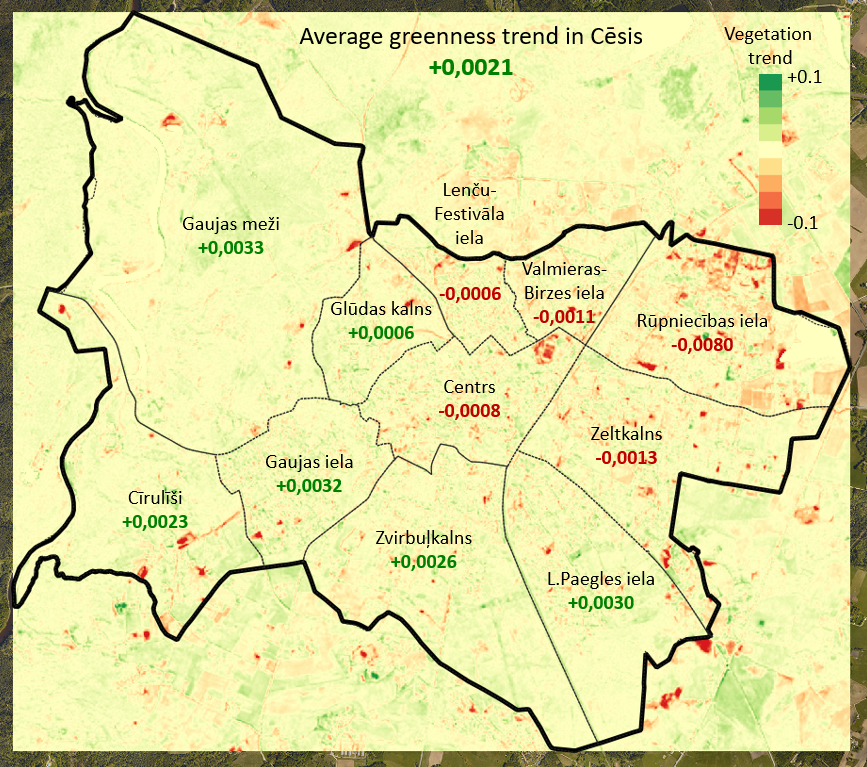
Vegetation changes in time could be analysed using mathematical models, thus obtaining a greenness trend (see Figure 2) where positive values represent vegetation intensity gain but negative values a vegetation intensity loss. An example of a linear regression model for the assessment of the vegetation trend’s temporal vegetation index data is shown in Figure 3. In overall, a slight positive greenness trend (2016–2020) was identified in 61% of Cesis territory with an average trend value of +0.0021. It means that overall vegetation intensity increases by 0.2% on average every year. In contrast, a negative greenness trend was observed in 37% of Cesis territory, and significant vegetation loss has been detected in 10% of the territory (appears as red spots in Figure 2). Significantly negative greenness trends most probably correspond to areas with construction activity. The districts with a positive greenness trend are the same ones where the green area percentage was higher in comparison to the overall in Cēsis. A negative trend could be observed in central and north-eastern districts where the notably negative trend is in the industrial district (Rūpniecības iela). In the case of city centre (Centrs), the stadium appears as a large red spot with negative greenness trend due to reconstruction in 2017 where new infrastructure was built and natural grass cover was replaced with artificial grass.
Mapping of biological value represents biodiversity potential of a certain area and is based on the evaluation of different landscape aspects – diversity of ecosystems, their fragmentation and border effect, biotope size and connectivity. The main components used for biological value assessment are:
- Biologically valuable land cover presence and border effect
- Unit size of biologically valuable land cover class
- Connectivity of biologically valuable land cover units
- The presence of protected biotopes and species
- The negative impact of roads and railways
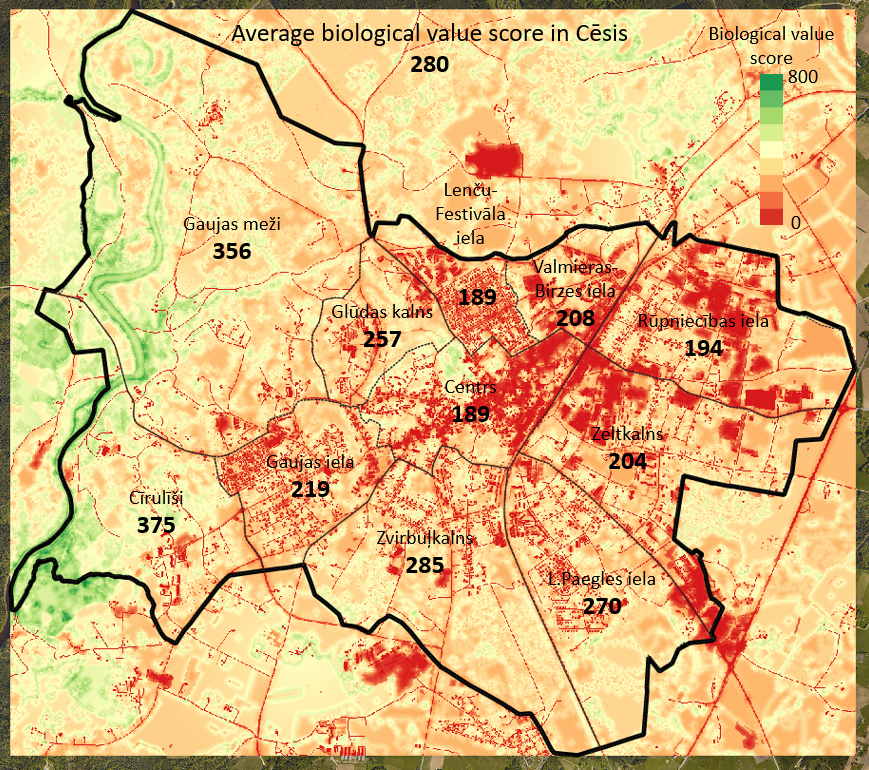
These parameters could be mapped and combined to produce a biological value assessment, see the example for Cēsis in Figure 3. Higher values indicate areas with a larger biodiversity potential. The areas with the highest biological value are mostly located in the River Gauja valley due to relatively large and well-connected land cover units as well as the presence of protected biotopes and species. The castle park has the highest biological value in the centre of Cesis. The lowest values occur in densely built areas as well as roads and railways. The overall biological value score in Cēsis is 280 where the districts of Cīrulīši and Gaujas meži have the highest scores (375 and 356, respectively). The districts with lowest biological values are Centrs, Lenču – Festivāla iela and Rūpniecības iela. Such mapping allows us to identify hotspots of biological value and to compare changes in the future.
The main advantage of geospatial data products is a detailed insight in the area of interest, and comparability. The methodology could be applied to compare different districts as well as different cities.