
Visualising the future of our shared space makes urban planning more predictable and tangible. Hence the Visual-Spatial Planning approach is used to foster engagement and qualitative co-creation. Data-driven decision-making has an important role towards smart, agile urban development, a city able to quickly change, adopt and develop within an ever-changing environment which is one of Riga City’s strategic goals hand in hand with a city digital twin creation.
Visual tools, used by architects professionally, are seldom employed in spatial planning and participatory processes. Experts have assessed the representation means in spatial planning of Latvia to be more textual:
“…The experts in the planning field of Latvia acknowledge that spatial planning principles are not fully integrated into architectural and planning theories, practice and planning regulatory framework. Accordingly, …. visual representation in the context of spatial planning in Latvia is predominantly used and interpreted for developing and visually representing legally binding requirements of territorial development and much less for explaining of planning processes and results, as well as for illustrating of issues of strategic and spatial planning…experts also point out that currently employed visual communication forms are only partially understood by non-professionals in the planning. Until now, the planning field in Latvia has experienced a lack of comprehensive theoretical research on types of visual representation, functions, structure and methodical use.”
Palone, 2015
Open 3D GIS ESRI platform should justify the partnership and gear up agility to move forward with coordinated planning along the river. Simple and affordable tools on the ground (such as RoundMe, Google Lens, Google Earth etc.), along with high-end augmented reality and virtual reality projects can transform the existing partnership mosaic to a system, where all the pieces complement each other, increase flexibility and eliminate risks.
The main concern of the approach to be inclusive is served by the availability to zoom in and out while staying in the same field as well as freedom for the users to shape unlimited spatial patterns necessary for a particular case or cooperation process on a focused, very local as well as regional level. Implementation of an open GIS platform will advance incentives started in the Augmented Urbans project:
- Small-scale “lighthouse networks” of local piers are sewing together the river banks.
- Co-creation module is implemented via public digital platforms available for freehand drawing as well as 3D modeling and field work.
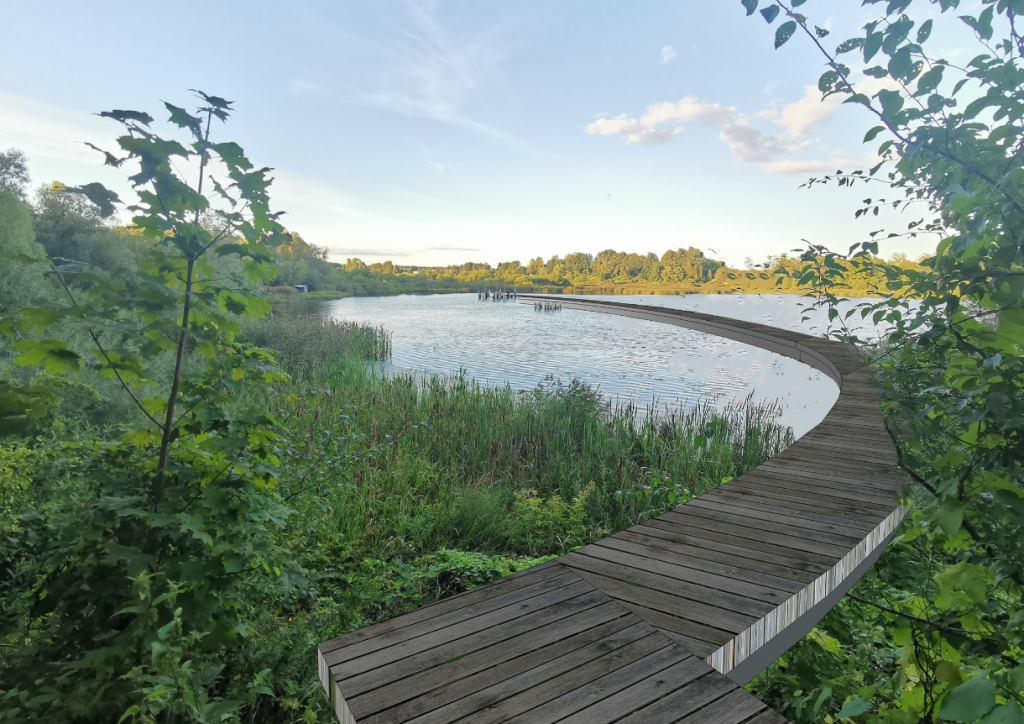
- The process of bridging the river is supported by small-scale projects, for instance, the Floating Arc shape walkway reaching the river ford to the island of Dole in Kekava.
A sample case of co-creation was carried out with Kekava partners using GoogleEarth and .kmz file exchange. Thus the aim to build smart digital twins and clouds will keep alive the human dimension and communications on the ground. Visual interpretation of data-driven decision-making and activities becomes an augmented reality stream along the river.
In the Kekava Local Touch workshop, a first version of the Riverine GIS of the project in ArcGIS format was presented to be ready for merging with Riga Open GIS. Co-creation on administrative level takes place in all case areas, which, thus far, have been planned and managed separately.
Local waterfront design elements emerged in the co-creation process via simple 3D design tools (SketchUp etc.) and were realised in modelling scale 1:1. Through co-creation, local identities were represented as 3D placemarks in Google maps, Roundme and similar affordable virtual means.
Some conclusions:
- Accessible and easy to use VR, XR tools such as 360 photos/videos i.e. Roundme, are recommended to be used to visually communicate the existing environment and/or future design intentions. It can be used to help educate the public and provide information in a more visually understandable manner, thus demonstrating seemingly high-end tech solutions to the general public.
- In order to effectively use an Open ArcGIS Platform across multiple municipalities as a tool for them, it should be incorporated in Spatial analysis practice, in addition to maintaining regular data collection, sharing and maintenance. Such a system in the Riga planning region can be started from the riverine point of view possessing common values as a public domain – spatial documentation for resilience planning.
- Construction information system (CIS in Latvian – “BIS”) should be part of GIS solutions to ensure data accessibility for professionals and city officials when needed.
- Tools showcased and tested in the Augmented Urbans project have the potential to satisfy remote planning and communication needs with captured spatial models, especially in times like a national/global pandemic.
An experimental test of Virtual reality tools
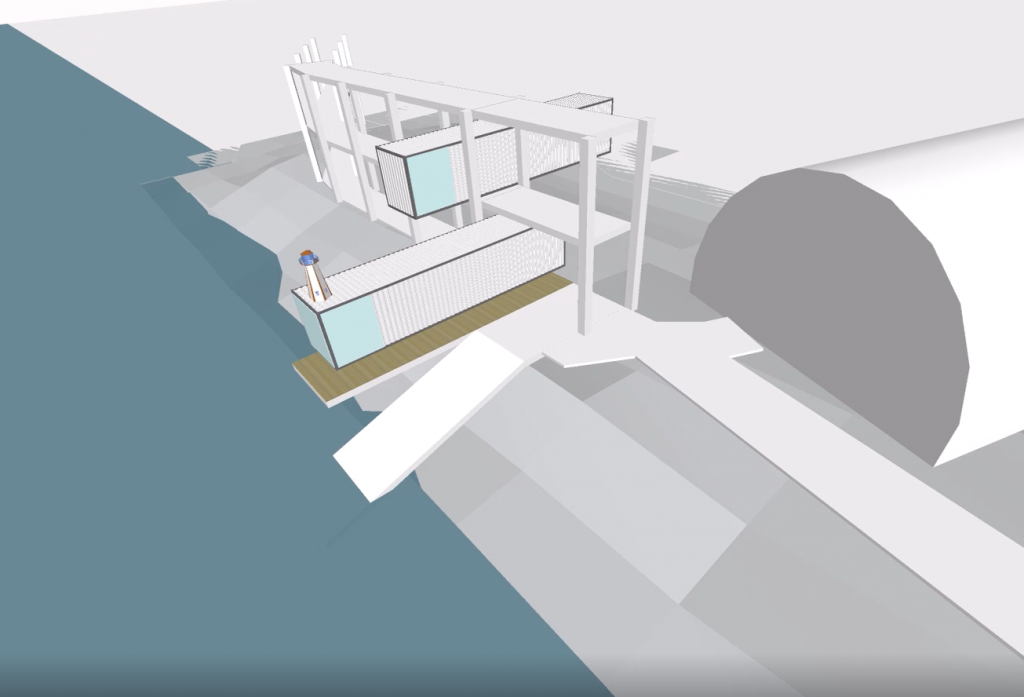
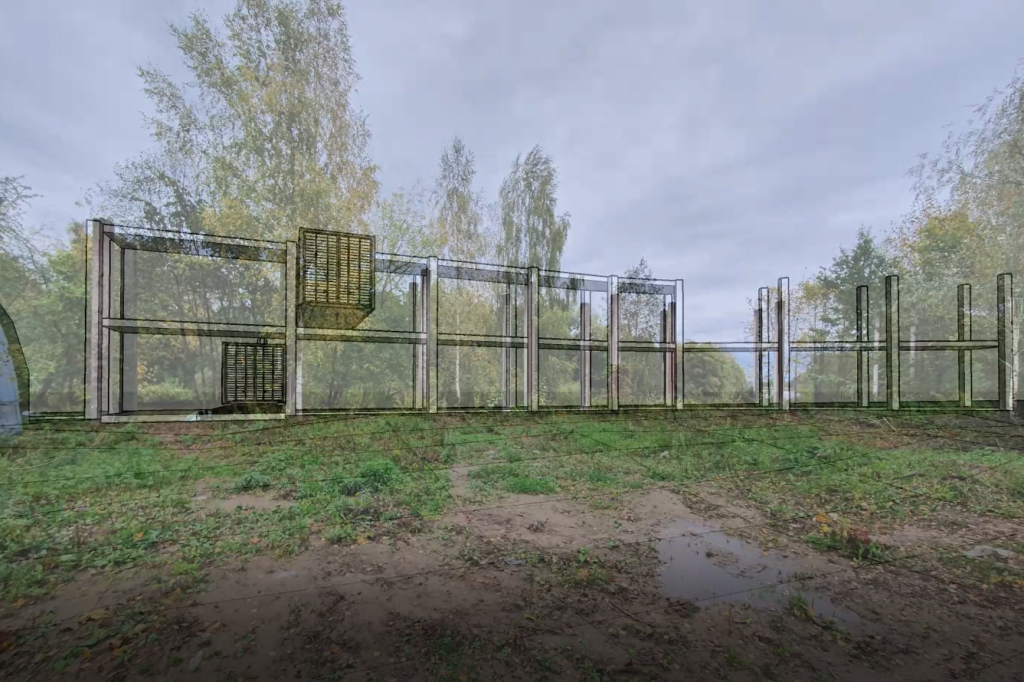
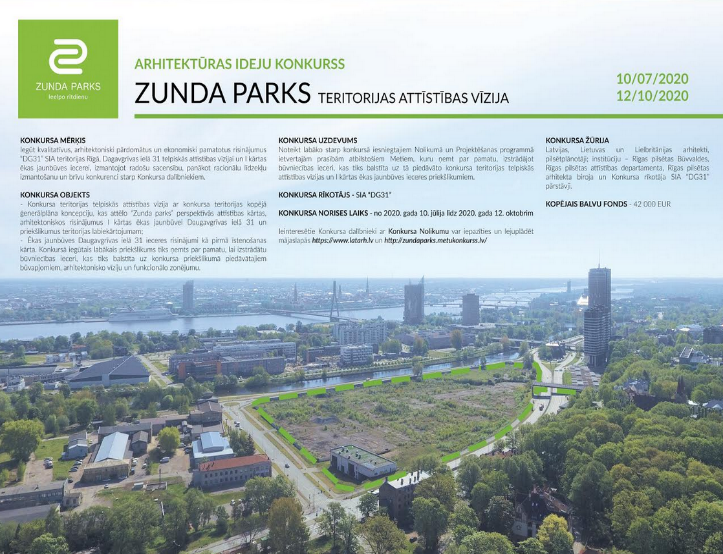
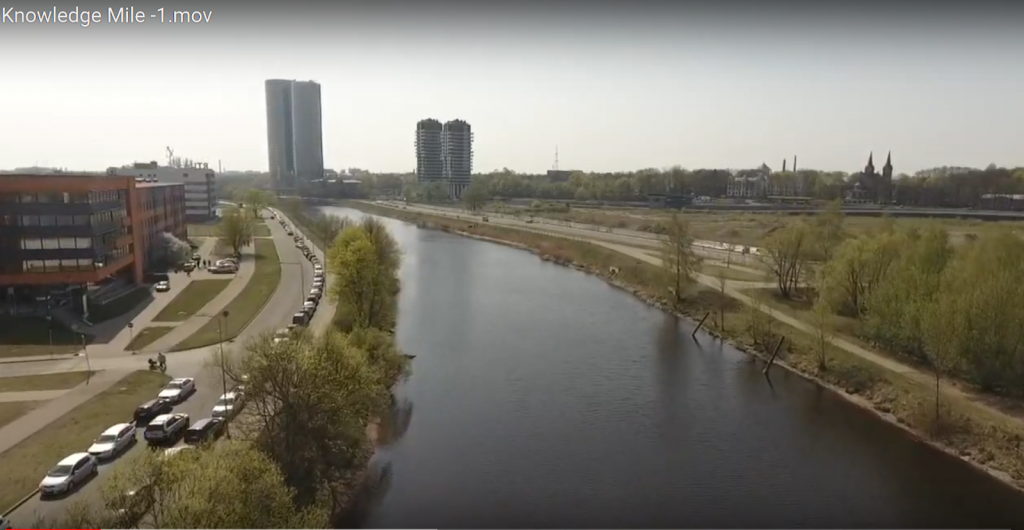
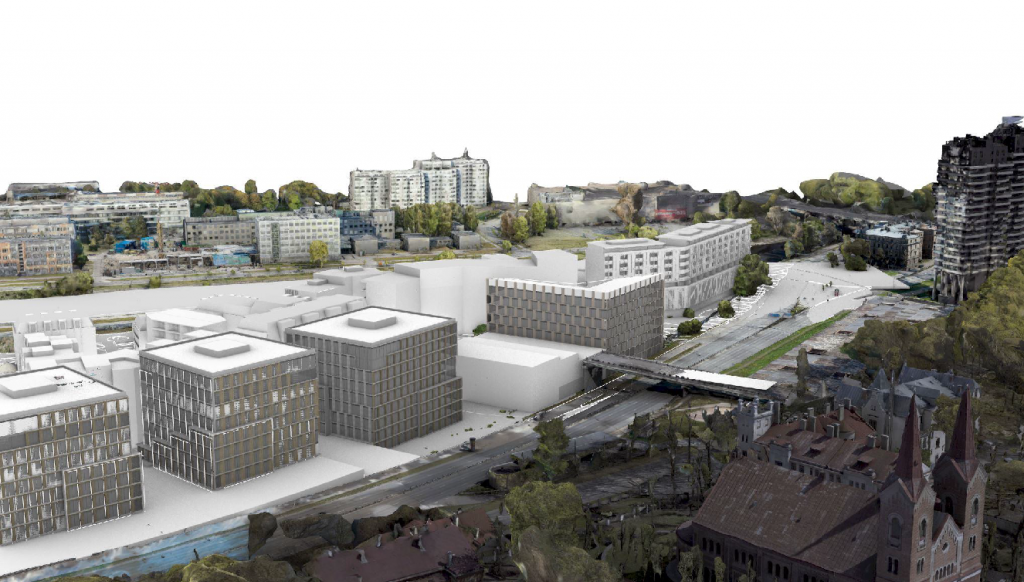
In autumn 2020, ambitious plans were made to create development visions for the Daugava waterfront. The open sketch design architecture competition provided an excellent opportunity to investigate XR tools within the Augmented Urbans project area and high-end architecture space. The competition task demanded the submission of the virtual reality models of the proposed new structures that were placed in the 3D point cloud of the planning area prepared by the Riga Technical University (RTU) Architecture Faculty students.
To create the competition 3D photogrammetry models, a few thousand images were taken to triangulate and create the virtual space using DJI Phantom Pro 4, Drone Deploy and Bentley Context Capture software.
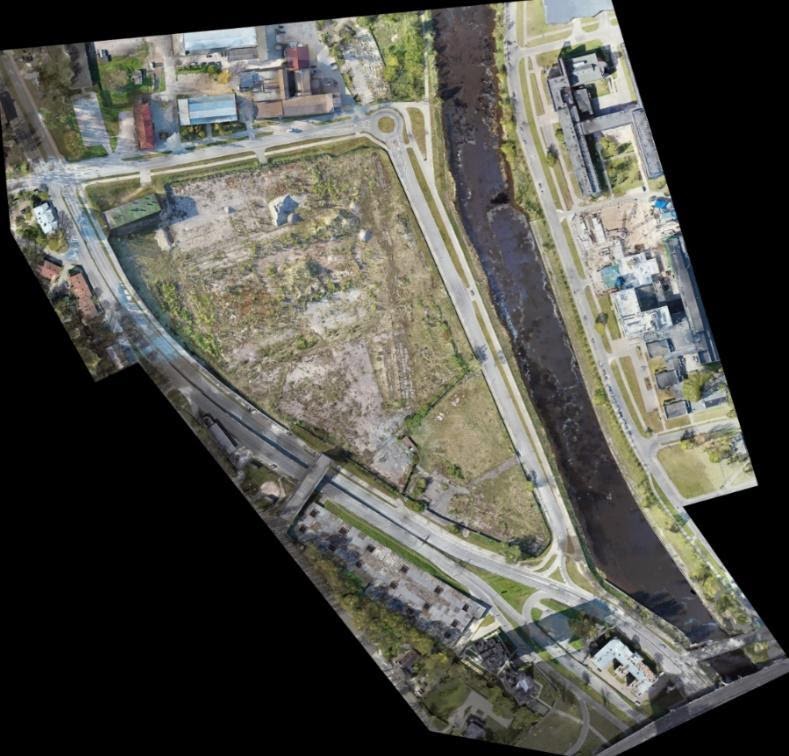
The main reason we provided the 3D and 2D data was to offer competition participants with high-quality spatial data and to enable the comparison of all entries in a 3D environment to remind of the surrounding context and to ensure the best concept would be selected for further development.
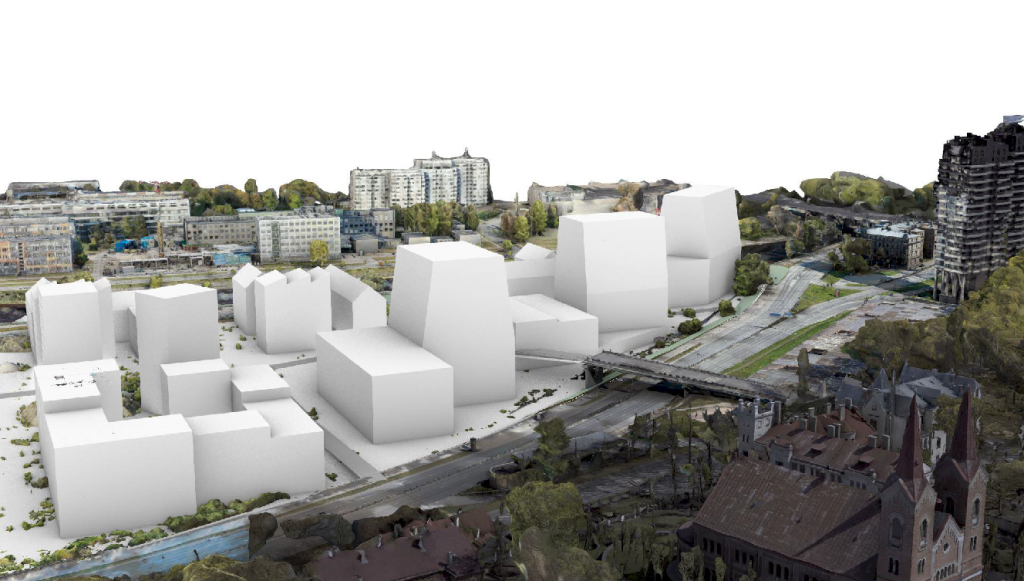
A total of fourteen competition entries were received. Embedding all entry 3D models in one platform to make comparing the proposals easy proved to be difficult. It was not possible to compile all the 3D models in one platform. Some of the problems stemmed from different file formats used by the participants. Everyone has a different toolset that they use, especially for a project on this scale. Many file formats were used .(ifc, .ls10, .skp, .3ds, .obj + .mtl, .3dm, .dwg) and most of them were not native formats, but exported ones, which resulted in some geometry issues. In addition, the variance in the level of detail between different models did not make the task any easier. The challenge was dealing and managing a higher level of detail in 3D models.
Tips and recommendations for the future
- Emphasising which file formats are supported to ensure easier 3D model integration into the 3D reality model. So far .obj and .dae file formats have worked out the best.
- To allow comparing multiple 3D models, defining a limit on the level of details for the 3D models (depending on the scale of the project) is crucial. This helps to ensure a smooth workflow and to create a user-friendly viewing experience.
- Implementing 3D reality models as a smart city solution or as a part of GIS is highly recommended, especially when aiming at data-driven decision-making in planning and urban design processes.
Upcoming new technologies on the horizon are expected to be capable of more easily processing large datasets. Thus, it is only a matter of time before we need not worry about the size of the 3D models and the level of details. On the other hand, instead of attempting to integrate the building information system as it currently is, we should seek a solution to separate the ‘skin from the bones’. This means light visual models and services beyond the traditional CAD track.
Having selected attribute sets attached to volumetric models can substantially enhance the application and evaluation features for modelling in the urban resilience framework, thus providing agility to meet the overall and crucial aim of resilience—being ready for change.
References
- Palone, I. Vizuālais attēlojums Latvijas telpiskajā plānošanā / Visual representation in spatial planning in Latvia.Promocijas darba kopsavilkums.– Rīga: RTU Izdevniecība, 2015.– 110 lpp.